Zoran Čučković
Important: This tutorial was made for QGIS 2, which is deprecated. For a tutorial made for QGIS 3, please go to https://landscapearchaeology.org/2020/viewshed-tutorial/.
I’ve had a remark recently that some kind of tutorial would be welcome for the visibility plugin. So here it goes…
The data which will be used can be downloaded from the plugin’s GitHub repo (link below). It comprises a DEM extracted from publicly available SRTM data (90 m resolution) and two sets of points (let’s call them A and B) which mostly correspond to archaeological sites I’m working on. The area in question is Istria (Croatia and Slovenia) and the projection is MGI Balkans 5 (EPSG : 31275).
A most basic use for the visibility analysis would be exploratory: would someone be able to see point B from point A? Such a query can be made by any viewshed algorithm available - but what about many observers from a number of points? In fact, when studying ancient landscapes we are often interested not only of what people could see, but also whether visibility influenced their preference for particular locations. For instance, is visibility a factor in the choice of settlement location?
For the purpose of this exercise, we would like to know whether sites A betray a preference for areas providing good visibility to sites B.
First step, obviously, we need to load the data in QGIS (any set of two shapefiles with points and one elevation model in raster format would do – provided coordinate reference systems match).
We can imagine two approaches to the problem: either we calculate visibility from A sites and test whether B sites tend to gather in their field of view or we calculate visibility areas from B sites and check whether A sites show a preference for good visibility zones. Let’s try the second approach.
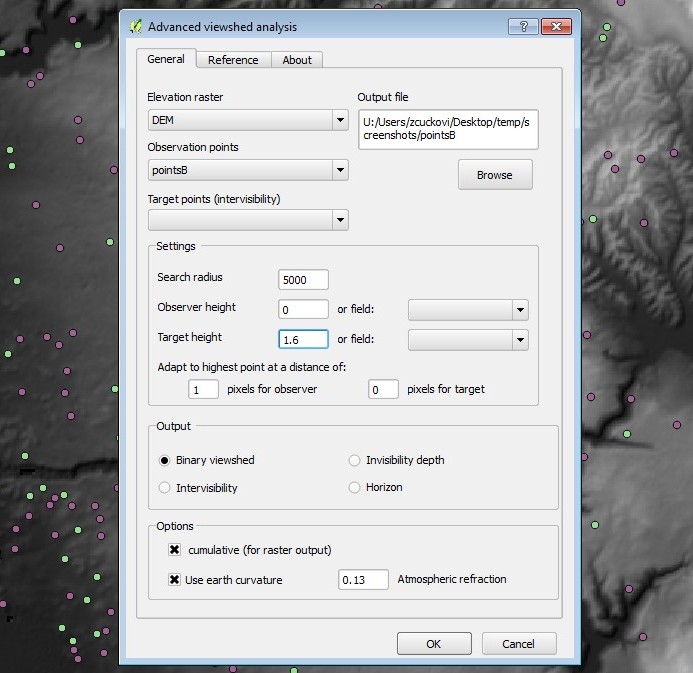
We need, then, to calculate all visibility areas from B sites and add them up. The result would be a cumulative visibility map, i.e. each point on a map will show how many observers could see it. Now, there is a problem of mutual intervisibility: usually we test visibility from some arbitrary eye-height towards bare ground. It wouldn’t have much sense to switch these two – looking from ground level to a possibly non-existent target – which means we need to take care of target and observer heights. In our case, we are not interested in what could be seen from sites B, but rather whether these sites could be seen from anywhere around and whether locations with good visual connections were preferred. We need to reverse the parameters: switch observer (now with 0 height) with target (now with observer height).
Finally, our dataset may have some inaccuracies and our points may fall behind the relief: for instance, a data point placed on a slope instead of the top of a hill. We can then force our points to climb to a higher point (adapt to the highest point), let’s say in a radius of one pixel (DEM used is coarse, a larger radius would risk our points drifting too far away).
The maximum visibility distance is set to 5000 metres. I would rather not discuss this parameter here (what people could see or would prefer to see, how large was the object observed etc.).
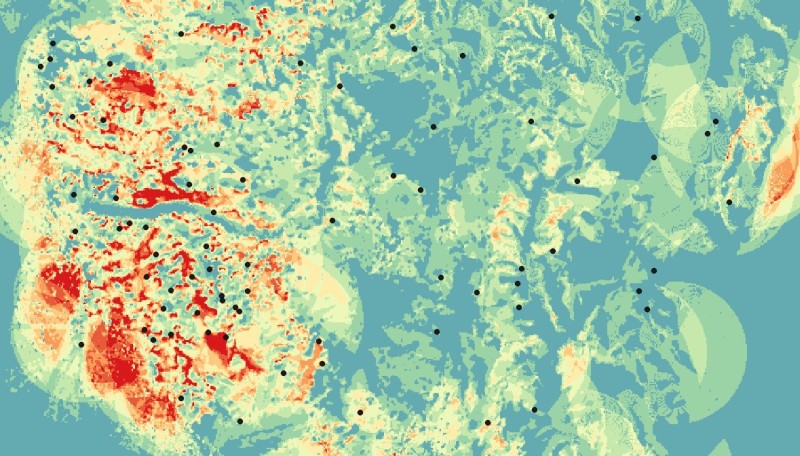
The result is a cumulative viewshed, here visualised as a heatmap (black points are our A sites).
Now there are some sophisticated statistical analyses devised for our case (in particular the one by Wheatly [1995] developed for intervisibility analysis). But let’s keep this tutorial non-academic. As a first step we can simply check whether cumulative visibility values under points tend to be above average.
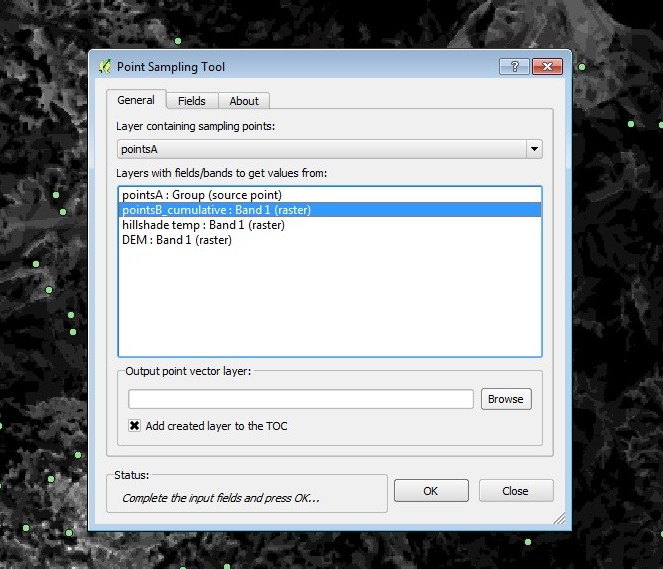
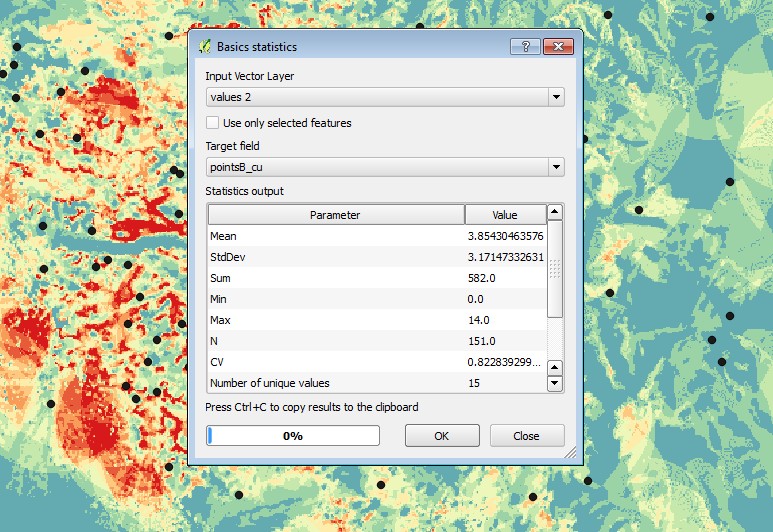
There are many ways to extract raster values at specified points, I’m using here the Point sampling plugin (reference below). Now we need to find out an average value: go to Vector > Analysis Tools > Basic statistics.
And then we check the raster average value which is normally visible in the metadata section of layer properties:
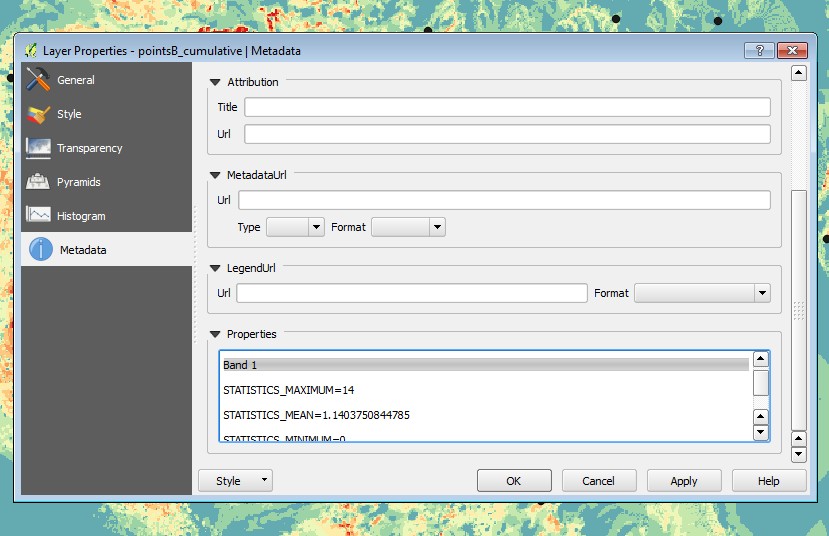
So, the average for the analysed area is just above one B site visible, while our A sites boast average visibility of close to four B sites. Now, this analysis is problematic because we didn’t take into account the fact that there is a large potion of the sea in the map - and many other “details” that I did not mention - but we do have our first visibility analysis!
Sources and bibliography
Dataset used: see at GitHub repo
Point sampling plugin : see in QGIS repository or check dedicated QGIS tutorial
Wheatley D (1995) Cumulative viewshed analysis: a GIS-based method for investigating intervisibility, and its archaeological application. In: Lock GR, Stančič Z, editors. Archaeology And Geographic Information Systems: A European Perspective. London: Taylor and Francis. pp. 171–186. [see online]